The buffers in all FPGAs to store data are quite large to offer some flexibility, but in most applications it makes sense to constrain the maximum amount of data:
- The ring buffers in each TDC channel can store up to 124 words - if these are filled by noise data it may generate more than 60 us of dead time for each trigger to scan the buffers for relevant data
- The event buffer in each TDC can store a few thousand words in total, with a limit of typically 500 words per event ("MaxEventSize", register 0x7111)
- The size of each sub-event (data sent over one Ethernet link) is limited to 60 kB or about 15,000 TDC words. This limit can be reached or exceeded quite easily.
The TDC and TrbNet offer two levels of data limiting:
- The buffer in each TDC channel can be reduced ("DataLimit", TDC GUI, register 0xc804).
- The amount of event data generated by an individual endpoint can be limited ("SetMaxEventSize",TrbNet -> Readout, register 0x7111). This should be adjusted such that data from all channels can be transported even if TDC buffers are full and at the same time, the maximum sub-event size can not be exceeded by all endpoints connected to the same Ethernet Link.
In setups with many front-ends and low hit occupancy it can be handy to discard data from all front-ends that didn't measure any hit - The overhead from TDC headers and reference time measurement sums up to quite large amounts. The endpoints can be configured to discard all events with less than a certain amount of data ("MinEventSize", TrbNet -> Readout, register 0x7114). Setting to 5 discards all data that just contains the reference time but no other hits.

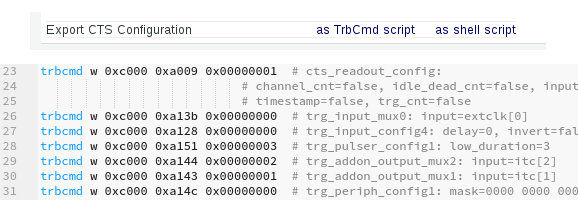
In case you want to store your CTS settings and load them automatically with the next DAQ startup, the CTS GUI has a handy export feature. It gives you all the settings of the CTS, including comments and speaking names of settings. You can just reference this settings file in your start-up script.

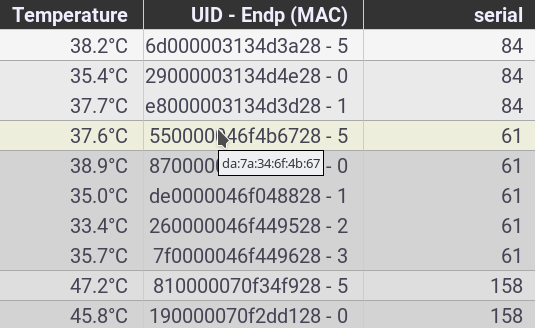
The network map now shows additional information: Besides a (rough, not necessarily complete) list of features implemented in the design, it now shows the unique ID and endpoint ID for each board. For the most common boards, the corresponding serial number is retrieved from the serials.db file and shown as well. Designs including a GbE interface also show their MAC address (in case of single-link designs which are not older than about one year).

The FPGA firmware to read out our
ADC AddOn has many built-in features:
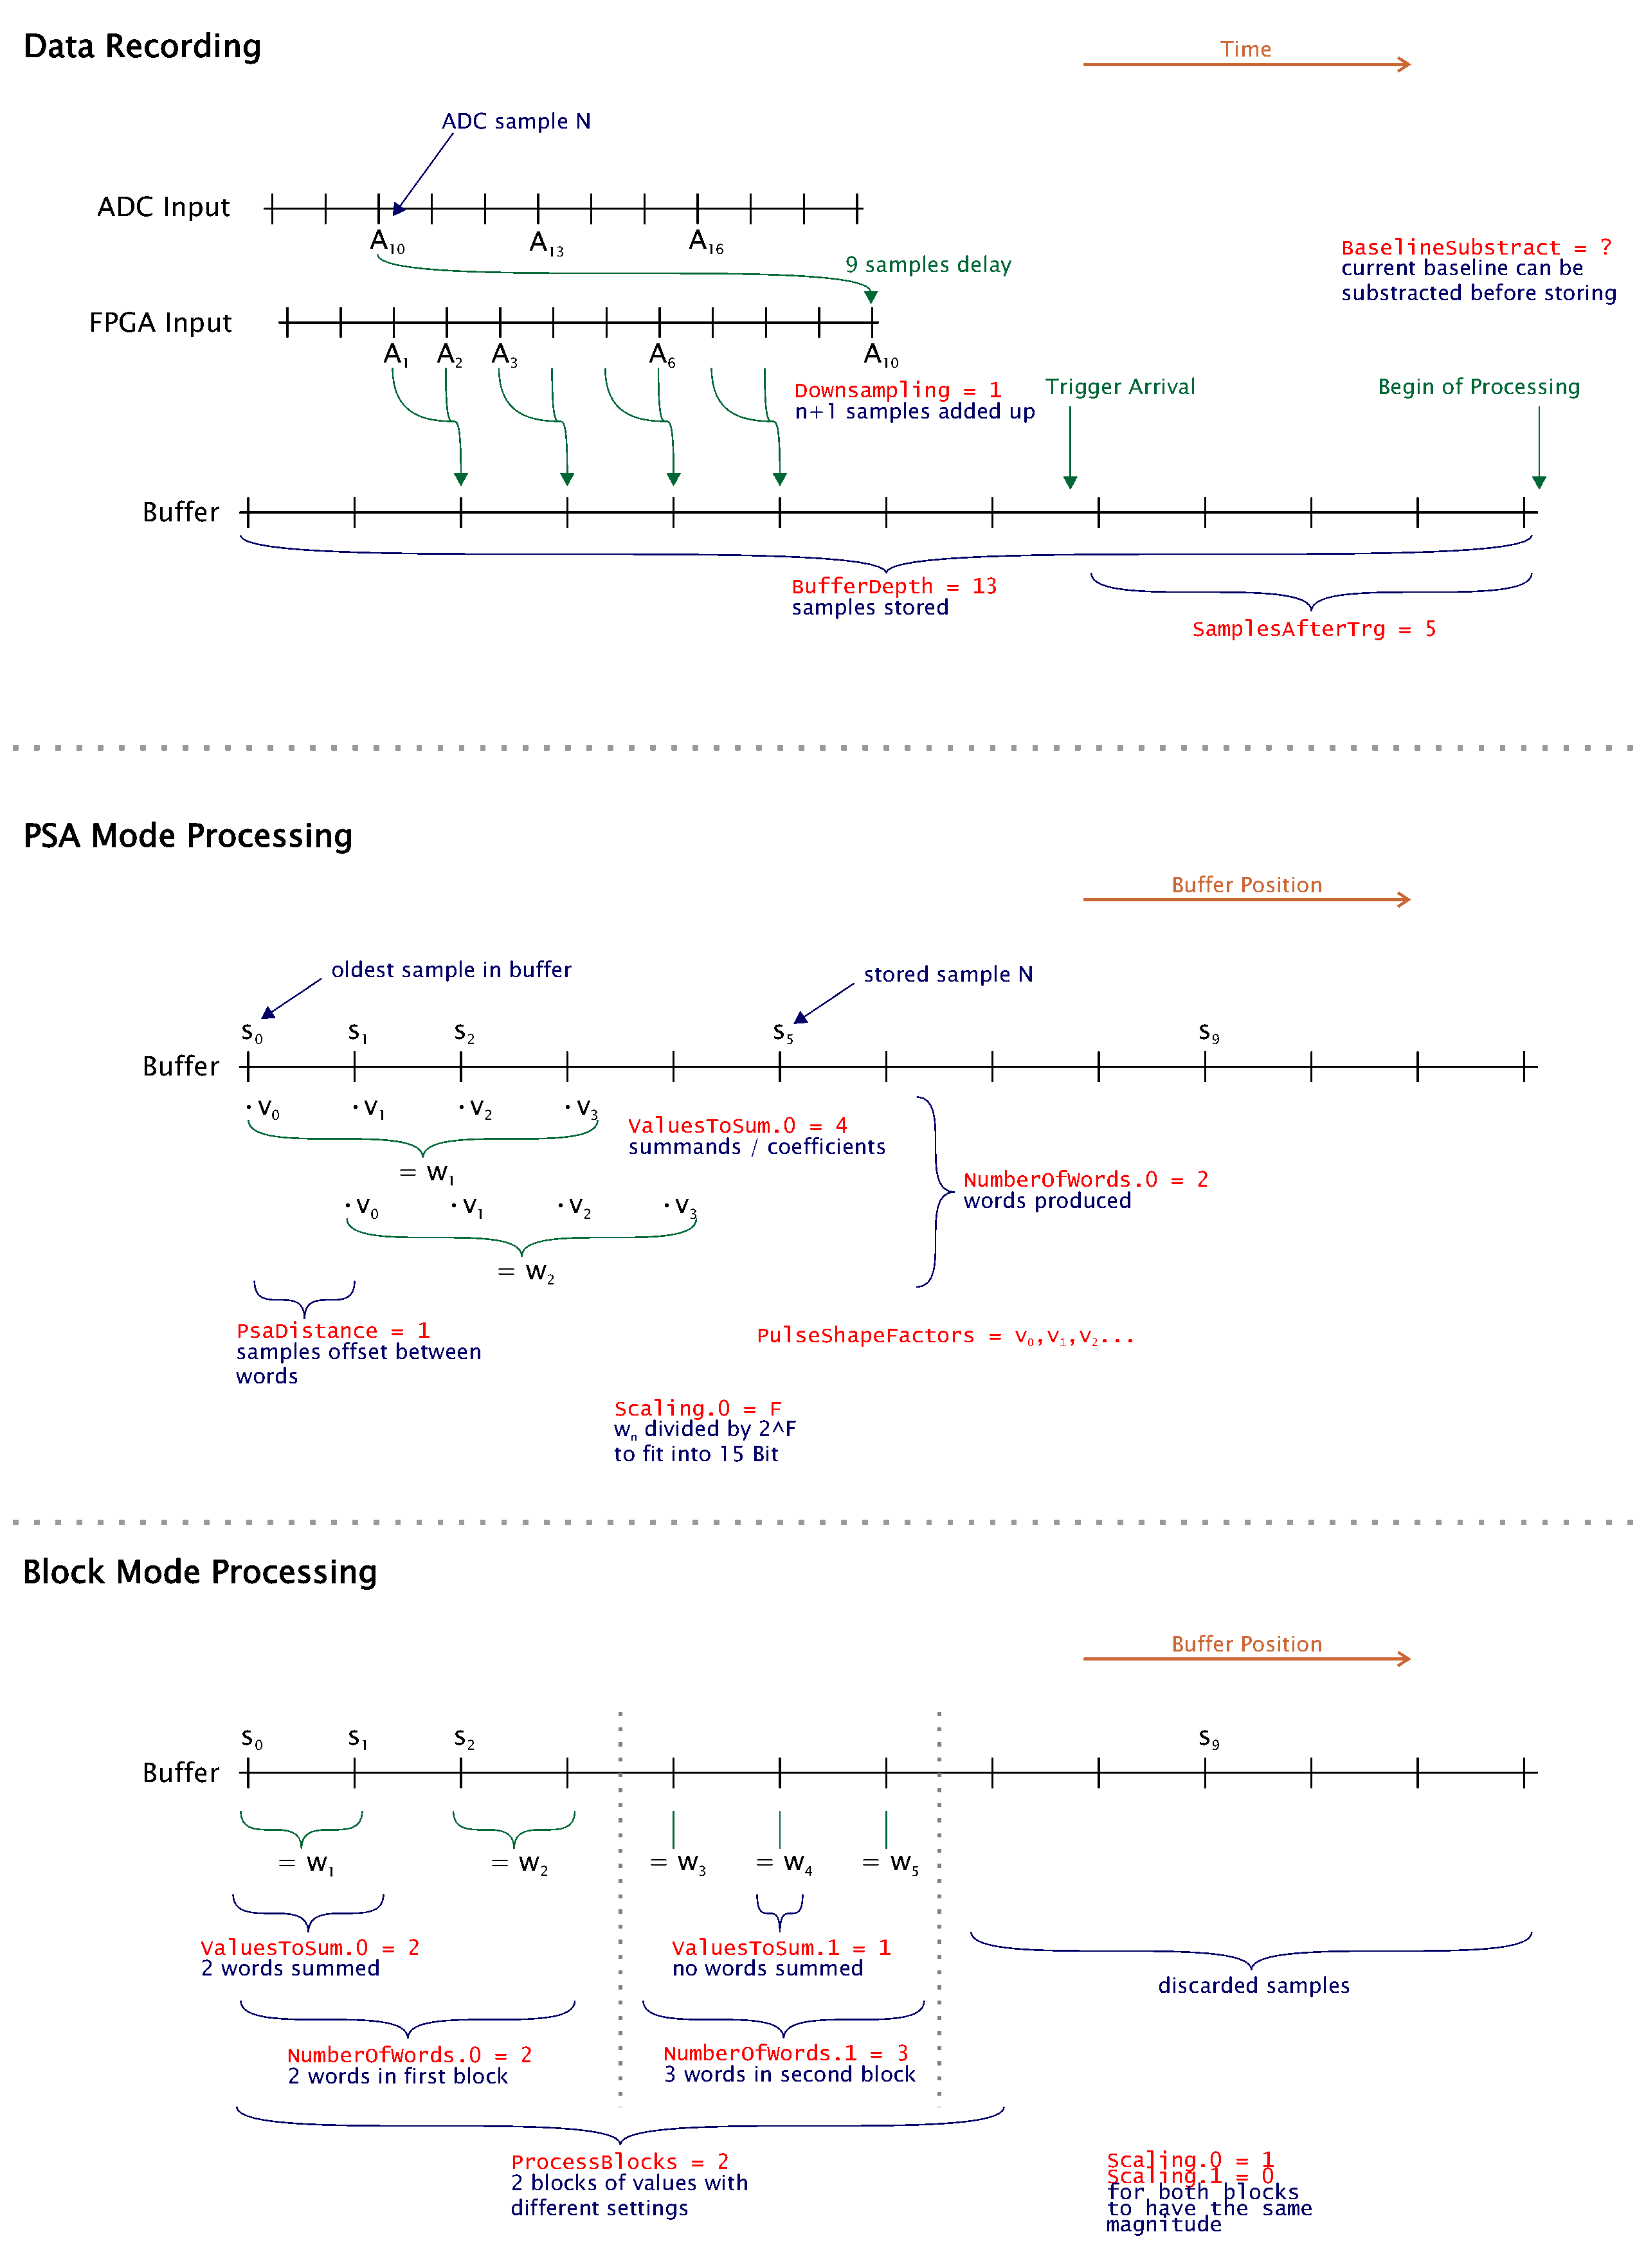
- Buffer depth, number of words to read-out, downsampling and samples taken after receiving a trigger are configurable
- Trigger Generation - a signal is sent to the CTS if a channel crosses the selected threshold
- Zero Suppression - a signal that did not cross the set threshold during the read-out window is ignored to save bandwidth
- Automatic Baseline calculation, used for the two features mentioned before
- Basic pulse shape analysis is available as well: A set of measured values can be convoluted with a user-defined table of coefficients
Please have a look at the TRB3 Documentation for further details.

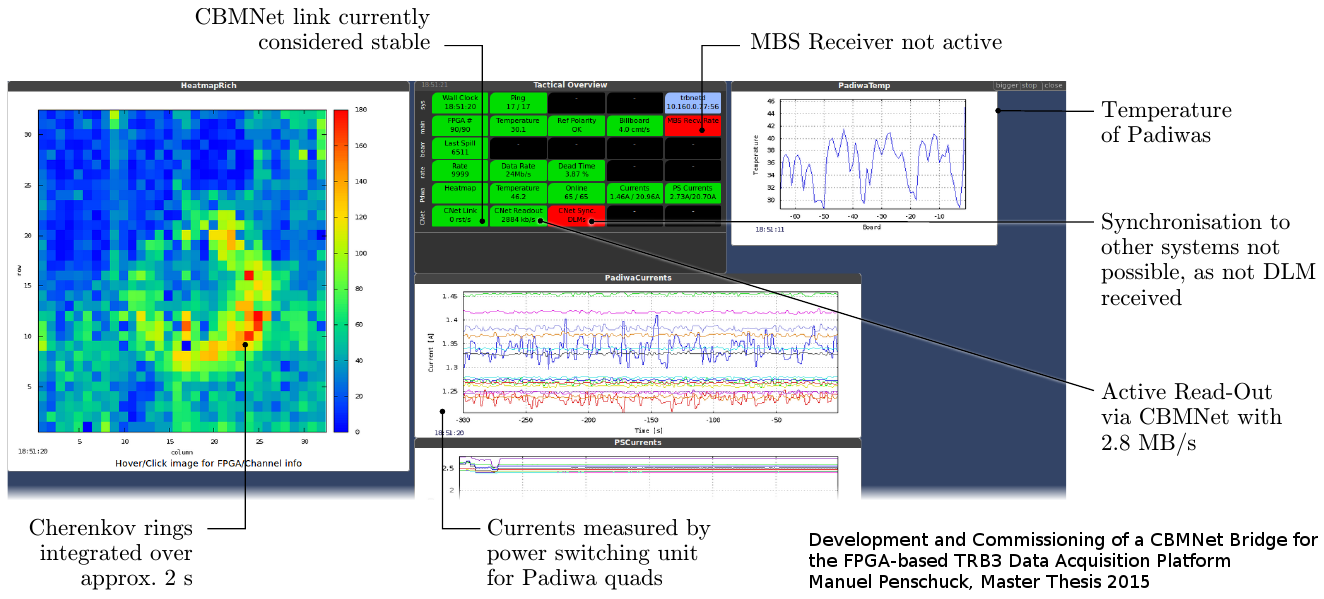
The Dmon tools (available from the daqtools repository) are a set of monitoring scripts that can be adapted to almost any slow control involved in testing a setup. Registers from TrbNet, EPICS variables and information from other sources can be mixed and displayed in graphs and tables. The central part is the "Tactical Overview" showing the current status using a simple color code. Configuration and all monitors are organized in independent script files to facilitate adaption to new applications. All information is accessible from any web browser, including mobile devices.


